Project Overview
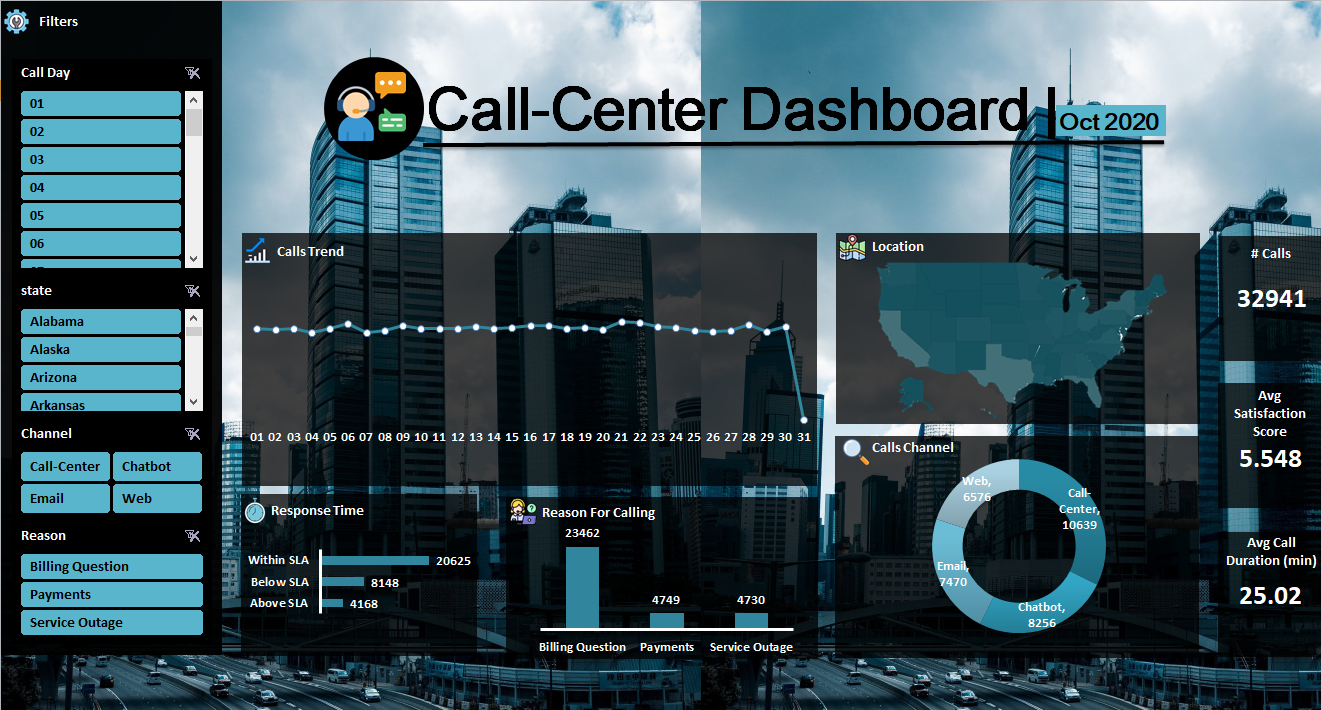
This interactive Excel dashboard analyzes the 2020 call center demo dataset from the U.S., providing actionable insights to enhance decision-making and operations. The dashboard reveals key findings including billing questions as the top inquiry, high customer satisfaction scores, and service level agreement compliance metrics. It also identifies trends like the 31st day of the month having the lowest call volume.
Technical Specifications
| Component |
Technology |
| Platform |
Microsoft Excel |
| Data Visualization |
Excel Charts, Pivot Tables |
| Data Processing |
Excel Formulas, Power Query |
| Data Source |
U.S. Call Center Dataset (October 2020) |
| Records Processed |
32,941 call records |
Key Features
Call Volume Analysis
- 32,941 total calls analyzed
- Daily call trend visualization
- State-wise call distribution map
Performance Metrics
- Average satisfaction score: 5.548
- Average call duration: 25.02 minutes
- SLA compliance tracking
Channel Breakdown
- Call Center: 10,639 contacts
- Chatbot: 8,256 contacts
- Email: 7,470 contacts
- Web: 6,576 contacts
Interactive Filters
- Filter by call day (01-31)
- Filter by U.S. state
- Filter by contact channel
- Filter by call reason
Key Insights
Top-Level Metrics
- Total Calls: 32,941 calls received during October 2020
- Customer Satisfaction: Average score of 5.548 (likely out of 7 or 10)
- Call Duration: Average of 25.02 minutes per call
Call Patterns
- Peak Days: Mid-month showed highest call volumes
- Lowest Volume: 31st day of the month had fewest calls
- Geographic Trends: Certain states showed significantly higher call volumes
Customer Concerns
- Top Reason: Billing Questions (23,462 calls)
- Other Issues: Payments (4,749), Service Outage (4,730)
Service Performance
- SLA Compliance: 20,625 calls handled within SLA
- Below SLA: 8,148 calls
- Above SLA: 4,168 calls
Technical Implementation
Data Processing
- Cleaned and transformed raw call center data using Power Query
- Created calculated fields for key metrics (duration, satisfaction, SLA compliance)
- Built data model to connect multiple data tables
Visualization Techniques
- Used combination charts for time-series analysis
- Implemented conditional formatting for SLA status indicators
- Created interactive slicers for user filtering
- Designed custom KPI cards for top-level metrics
Challenges & Solutions
| Challenge |
Solution |
| Handling large dataset in Excel |
Optimized with Power Pivot and data model |
| Creating geographic visualization |
Implemented map chart with state-level data |
| Dynamic metric calculations |
Used DAX measures for real-time updates |
| User-friendly interface |
Designed intuitive layout with clear visual hierarchy |
Business Impact
- Identified peak call times for better staff scheduling
- Highlighted most common customer issues for training focus
- Revealed channel preferences for resource allocation
- Provided SLA performance benchmarks for quality improvement
Future Enhancements
- Integration with live call center data feed
- Agent performance tracking metrics
- Call resolution time analysis
- Customer sentiment analysis integration
Back to Projects