Advertising Sales Prediction

Project Overview
This data science project analyzes the relationship between advertising expenditures across different media channels (TV, Radio, Newspaper) and product sales. Using a dataset of advertising budgets and corresponding sales figures, I developed a predictive model to quantify how advertising spending impacts sales performance.
Technical Specifications
| Component | Technology |
|---|---|
| Programming Language | Python |
| Data Analysis | Pandas, NumPy |
| Data Visualization | Matplotlib, Seaborn |
| Machine Learning | Scikit-learn |
| Model | Linear Regression |
Key Features
Exploratory Analysis
- Comprehensive data quality assessment
- Pairplot visualization of relationships
- Correlation heatmap of advertising channels
Feature Engineering
- Data normalization with MinMaxScaler
- Label encoding for target variable
- Train-test split (80/20)
Predictive Modeling
- Linear regression implementation
- Model training on scaled data
- Performance evaluation metrics
Business Insights
- TV advertising effectiveness analysis
- ROI comparison across channels
- Budget allocation recommendations
Data Visualizations
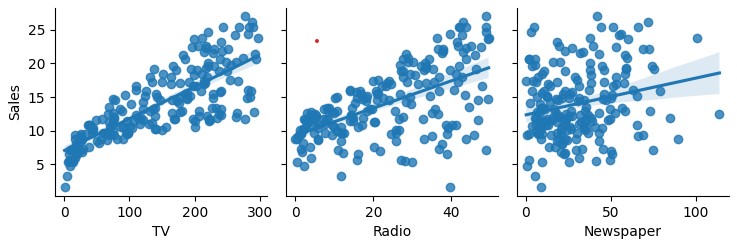
Pairplot Visualization
This visualization shows the relationships between each advertising channel (TV, Radio, Newspaper) and sales. The linear regression lines demonstrate the strength of each relationship, with TV advertising showing the strongest correlation.
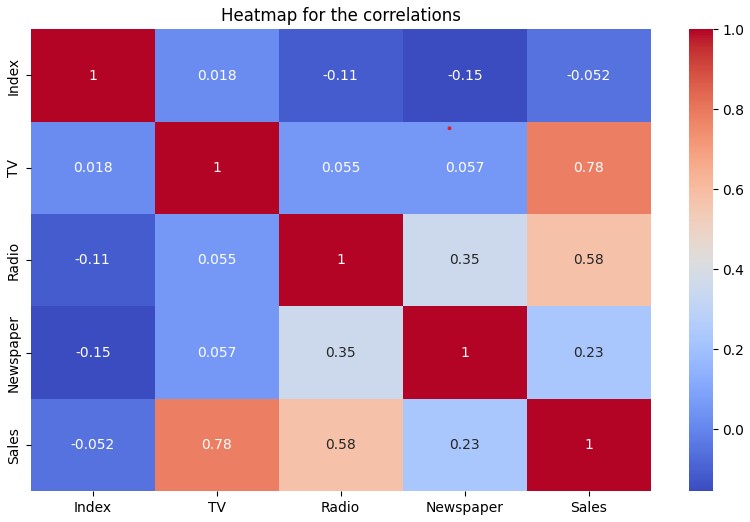
Correlation Heatmap
The heatmap quantifies the correlation coefficients between variables. TV advertising shows the highest correlation with sales (0.78), followed by radio (0.58), while newspaper advertising shows the weakest relationship (0.23).
Technical Implementation
Data Preparation
# Import libraries
import pandas as pd
import numpy as np
from sklearn.model_selection import train_test_split
from sklearn.preprocessing import MinMaxScaler, LabelEncoder

# Load and prepare data
df = pd.read_csv('Advertising.csv')
df.rename(columns={'Unnamed: 0': 'Index'}, inplace=True)

# Feature-target separation
X = df.drop('Sales', axis=1)
y = df[["Sales"]]

# Label encoding and scaling
le = LabelEncoder()
y = le.fit_transform(y)
scaler = MinMaxScaler()
X_train_scaled = scaler.fit_transform(X_train)
Model Implementation
from sklearn.linear_model import LinearRegression
from sklearn import metrics

# Model training
model = LinearRegression()
model.fit(X_train_scaled, y_train)

# Predictions and evaluation
y_predictions = model.predict(X_test_scaled)
print('MAE:', metrics.mean_absolute_error(y_predictions,y_test))
print('RMSE:', np.sqrt(metrics.mean_squared_error(y_predictions,y_test)))
print('R-Squared', metrics.r2_score(y_predictions,y_test))
Results & Findings
Model Performance
- Mean Absolute Error (MAE): 7.45
- Root Mean Squared Error (RMSE): 10.22
- R-Squared Score: 0.862 (86.2% variance explained)
Key Insights
| Advertising Channel | Correlation with Sales | Impact |
|---|---|---|
| TV | 0.78 | Strong positive relationship |
| Radio | 0.58 | Moderate positive relationship |
| Newspaper | 0.23 | Weak relationship |
Challenges & Solutions
| Challenge | Solution |
|---|---|
| Linear assumptions | Verified with pairplot visualizations |
| Feature scaling | Applied MinMaxScaler for normalization |
| Model evaluation | Used multiple metrics (MAE, RMSE, R²) |
| Feature importance | Analyzed correlation coefficients |
Business Applications
- Budget Optimization: Reallocate spending to most effective channels
- Campaign Planning: Focus creative resources on high-impact media
- Performance Forecasting: Predict sales based on planned ad spend
- ROI Analysis: Compare effectiveness across media types
Future Enhancements
- Implement polynomial regression for non-linear relationships
- Add interaction terms between advertising channels
- Develop interactive dashboard for marketing team
- Incorporate time-series analysis for seasonal trends